Tremor: Data Visualization Platform for Modern Dashboards
In today's data-driven world, the ability to effectively visualize data has become paramount for businesses across industries. Companies constantly grapple with the challenge of creating visually appealing and user-friendly dashboards to provide insights to their customers. This task often demands substantial resources from both engineering and design teams, leaving many businesses with underwhelming solutions and missed revenue opportunities.
But what if there was a solution that could transform this cumbersome process into a seamless experience for developers and designers alike? Enter Tremor, a groundbreaking startup founded in 2023 by three visionary individuals: Achilleas Mitrotasios, Christopher Kindl, and Severin Landolt. Tremor aims to revolutionize the world of data visualization by offering a platform that simplifies the creation of customer-facing analytics dashboards. In this article, we'll delve deep into the world of Tremor, exploring its origins, its mission to solve a pressing problem, and the exceptional team driving its success.
Who Are the Masterminds Behind Tremor?
Any journey into the heart of Tremor must begin by getting to know the brilliant minds that brought this innovative startup to life. Achilleas Mitrotasios, Christopher Kindl, and Severin Landolt, collectively known as the founders of Tremor, possess a unique blend of expertise that forms the foundation of their venture.
Achilleas Mitrotasios
Achilleas Mitrotasios, one of the co-founders of Tremor, brings a wealth of experience as a Data Scientist. Prior to co-founding Tremor, he spent three years honing his skills at Accenture, where he specialized in the development of dashboards. Achilleas's passion for open-source projects is exemplified by his impressive 11K GitHub stars, showcasing his commitment to the community. His expertise in designing analytical interfaces has been instrumental in shaping Tremor's vision.
Christopher Kindl
Christopher Kindl, another key figure at Tremor, is a co-founder and integral to the startup's success. Like Achilleas, Christopher also worked at Accenture for over three years, lending his expertise to building dashboards for Fortune 500 companies. His experience in data visualization and analytics forms a crucial part of Tremor's mission to simplify the dashboard creation process.
Severin Landolt
Completing the trio of co-founders, Severin Landolt, rounds out the dynamic team at Tremor. Having known each other since university, Severin, Achilleas, and Christopher decided to embark on this entrepreneurial journey together. Severin brings a unique perspective, having previously worked as a software engineer at Bloomberg. His technical acumen and vision have played a pivotal role in shaping Tremor's identity.
The Birth of Tremor: From Open-Source Library to Dashboard Builder
The inception of Tremor can be traced back to its roots as an open-source UI library designed to create dashboards. Remarkably, within just ten months of its launch, the library garnered over 10,000 GitHub stars. This early success highlighted a significant gap in the market – the need for user-friendly dashboards that developers could build with ease.
The Problem: Visualizing Data Made Complex
One of the most common challenges faced by SaaS companies and businesses in the digital age is the need to visualize data for their end-users. While data visualization is crucial for providing insights and enhancing user experiences, creating customer-facing dashboards from scratch can be a daunting task. It often demands substantial efforts from both engineering and design teams, making it an impractical endeavor for many companies, especially when analytics is not their core product offering.
This lack of resources dedicated to building a visualization layer leads to several issues:
Underwhelming User Experience: When dashboards are hastily constructed due to resource constraints, they often result in subpar user experiences. This can leave customers dissatisfied and hinder the overall value proposition of the product or service.
Missed Revenue Opportunities: Incomplete or poorly designed dashboards can lead to missed opportunities for revenue generation. Valuable insights that could have driven decision-making and upselling are lost in the process.
The Solution: Tremor - Simplifying Data Visualization
Tremor recognized these pain points and set out to provide a game-changing solution. The Tremor Platform was born, and it's poised to become the Webflow for dashboards, simplifying the process of creating visually stunning and functional dashboards for developers and businesses.
So, how does Tremor plan to revolutionize data visualization?
The Tremor Platform offers the following solutions:
Connect to Data Sources: Users can seamlessly connect to their data sources, enabling the integration of real-time data into their dashboards.
User-Friendly Interface: Tremor's platform boasts an intuitive, easy-to-use interface that empowers developers and designers to create dashboards without the need for extensive coding or design skills.
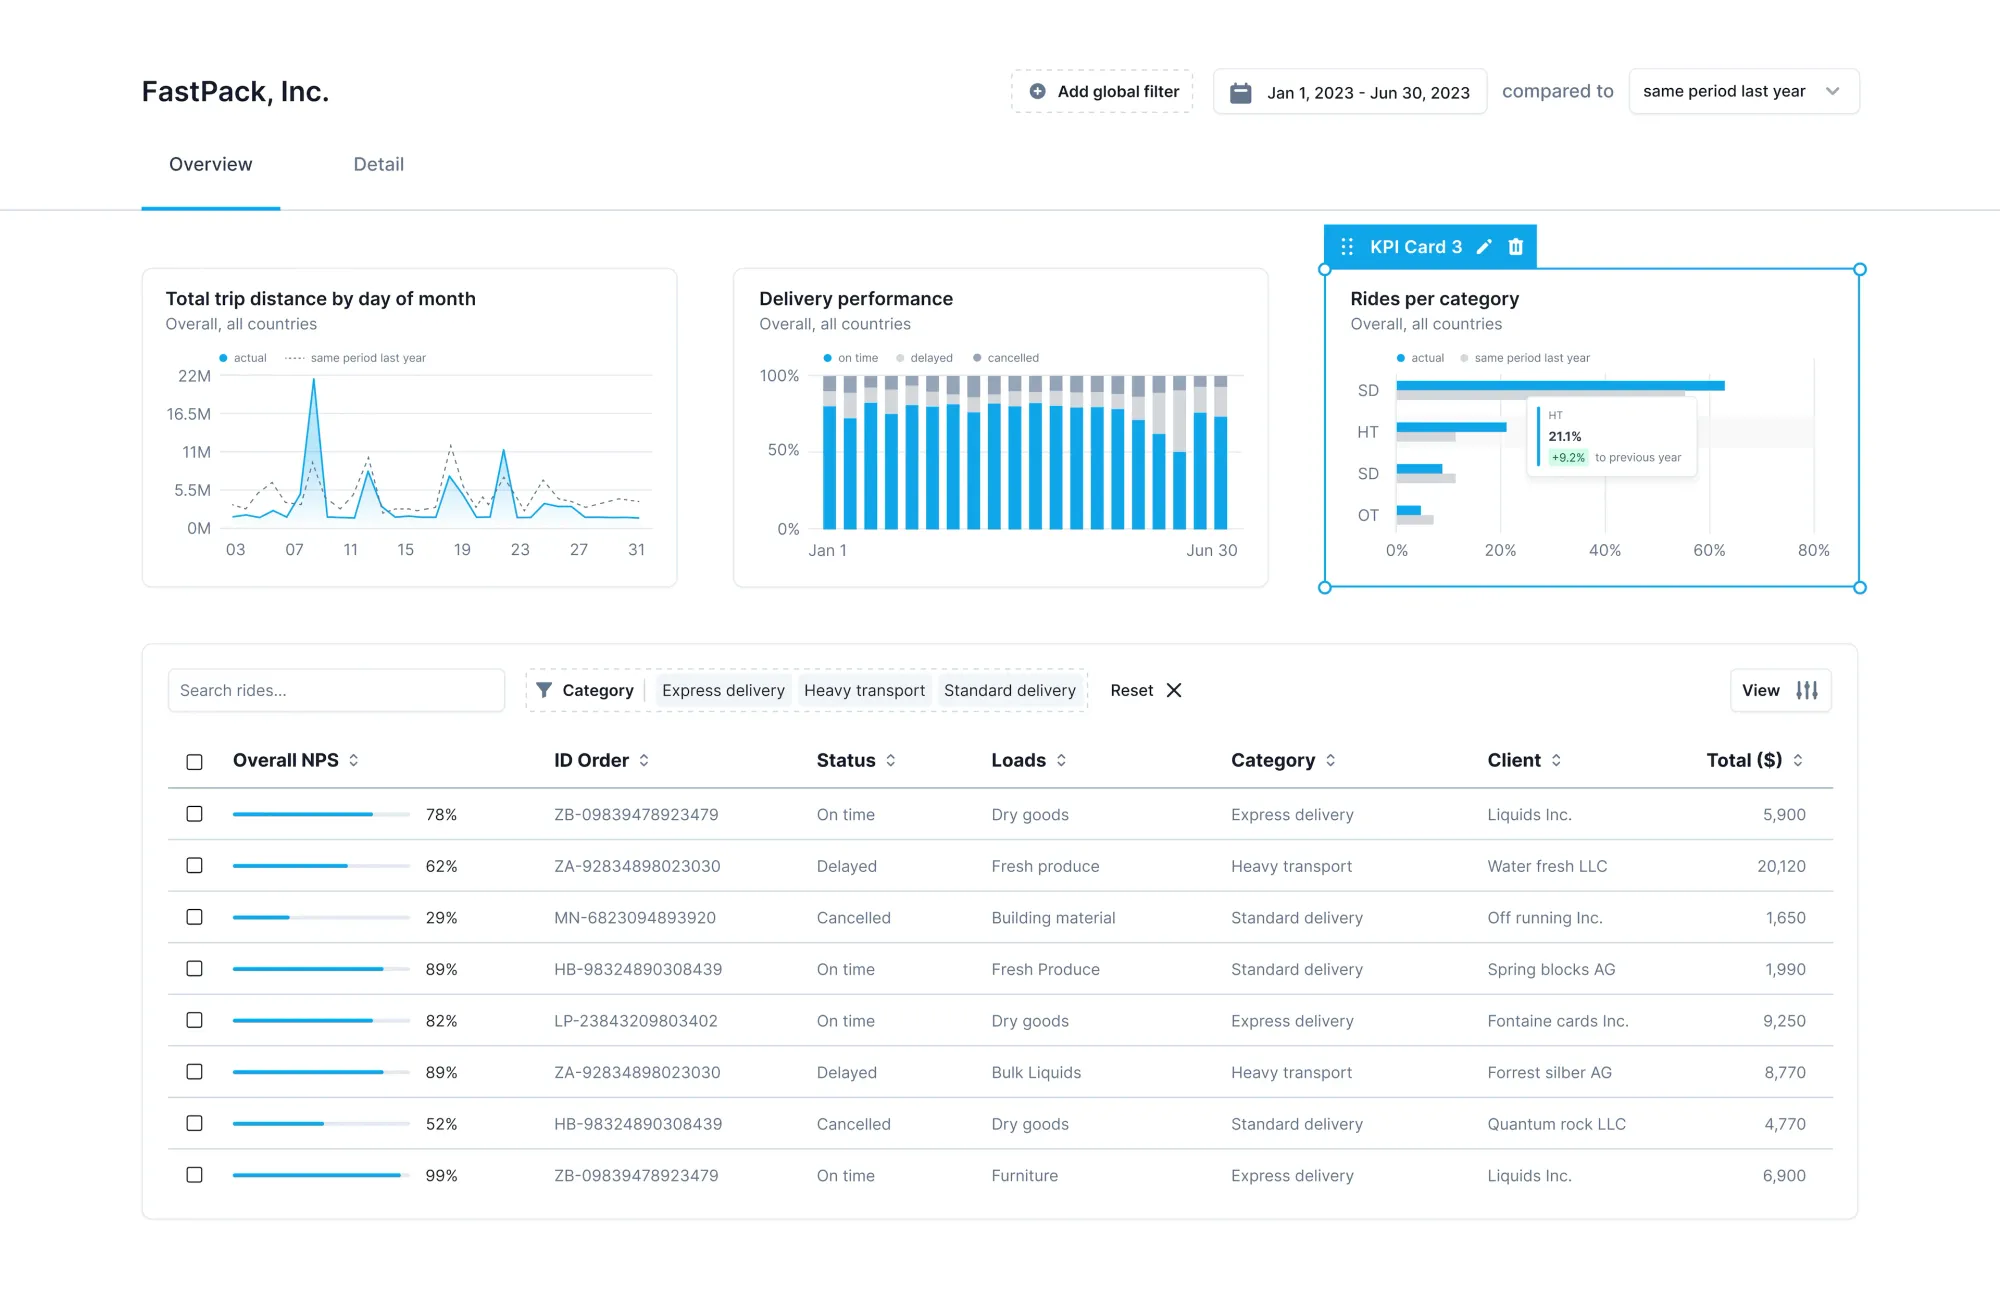
White-Labeled Analytics Layer: Tremor allows businesses to embed their dashboards as a performant, white-labeled analytics layer into their existing applications. This means that, for example, a bank could swiftly deploy a dashboard that visualizes spending patterns to their customer portal in a matter of days, rather than the traditional months-long timeline.
Tremor's solution bridges the gap between complex data and user-friendly dashboards, making it accessible to businesses of all sizes and industries. Whether you're a startup looking to enhance your product offerings or a well-established corporation seeking to provide valuable insights to your customers, Tremor has the answer.
Tremor's Path to Success
Tremor's journey from an open-source project to a promising startup has been nothing short of remarkable. The team's passion for solving a prevalent problem in the industry, coupled with their expertise, positions Tremor as a formidable player in the world of data visualization.
The Vision
Tremor envisions a future where data visualization is no longer a barrier for businesses. Their mission is to empower developers and designers to create stunning dashboards with ease, ultimately enhancing the user experience and driving revenue growth for businesses across the globe.
The Impact
The impact of Tremor's solution extends far beyond simplifying data visualization. By democratizing dashboard creation, Tremor enables businesses to make data-driven decisions and uncover insights that were previously hidden. This newfound accessibility to data-driven insights has the potential to transform industries and drive innovation.
Conclusion
In a data-centric world, the ability to harness the power of data visualization is a game-changer for businesses. Tremor, with its visionary founders and innovative platform, is poised to revolutionize the way we create and interact with dashboards. With its user-friendly interface, seamless data integration, and white-labeled analytics layer, Tremor is on a mission to make data visualization accessible to all.
As Tremor continues to gain traction and shape the future of data visualization, one thing is certain: the startup's journey has only just begun. With its relentless pursuit of simplifying data visualization, Tremor is set to unlock the true potential of data for businesses worldwide, making data visualization a seamless and rewarding experience for all. Stay tuned as Tremor paves the way for a future where data speaks, and businesses listen.